Flet Charts
Last year we introduced support for Matplotlib and Plotly charts. Both libraries are able to export charts as SVG images which are then displayed in a Flet app. However, such charts, while serving the purpose of visualization, are lacking interactivity and animation.
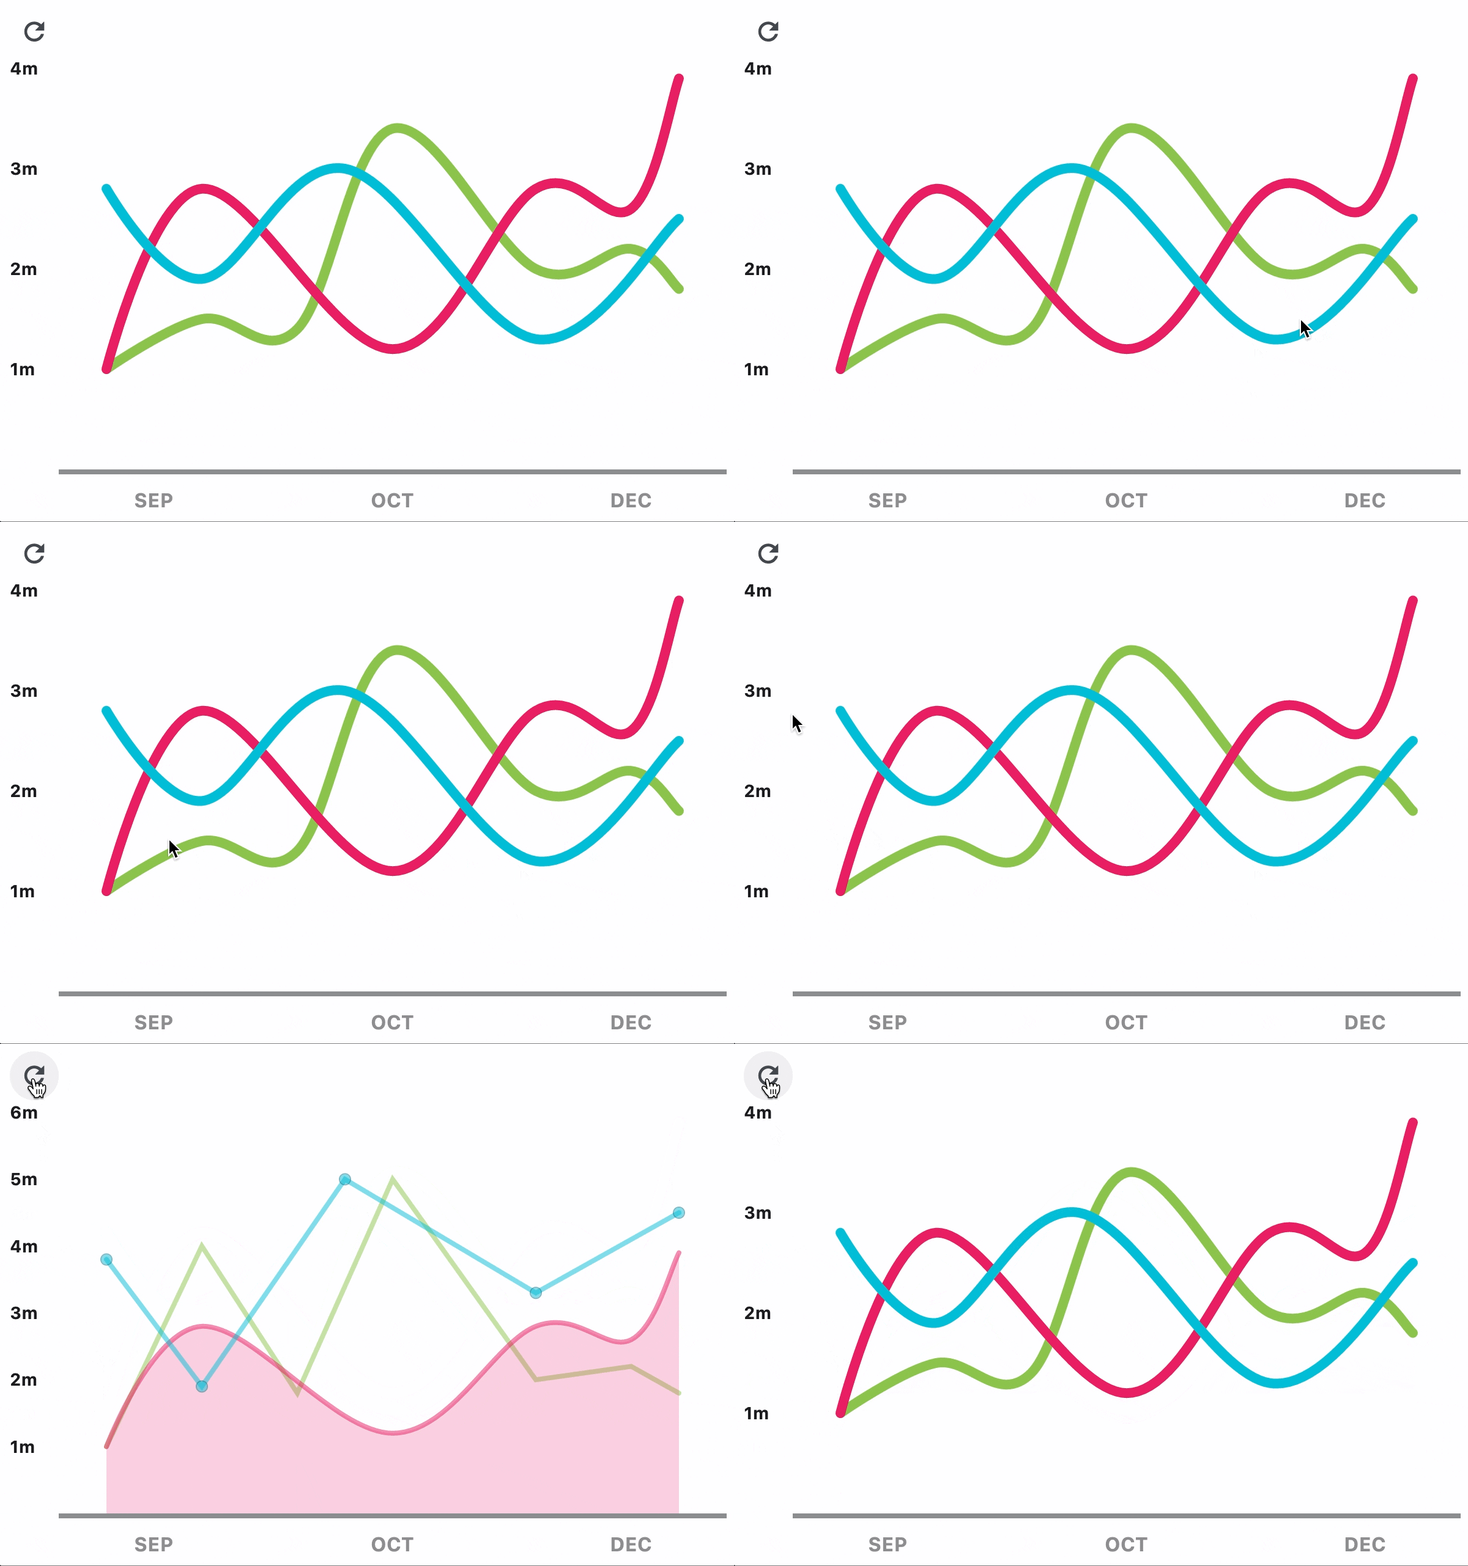
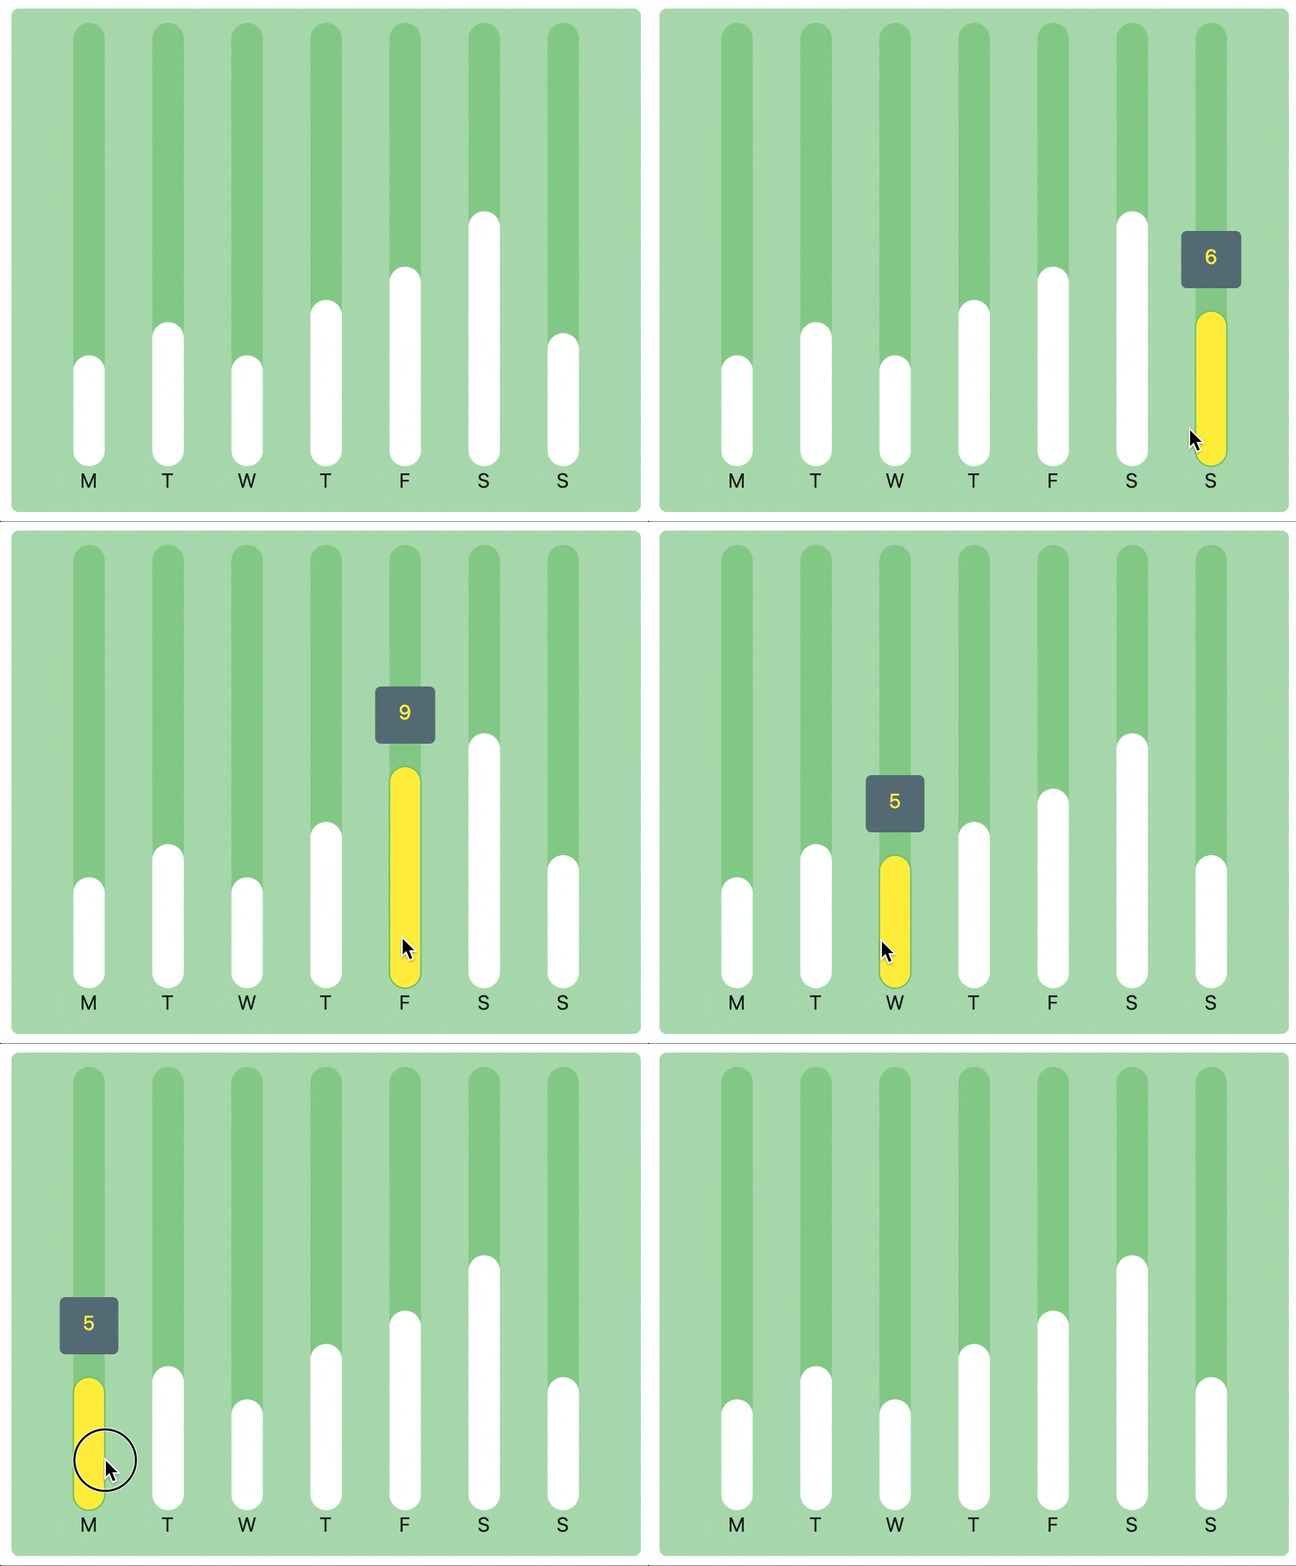
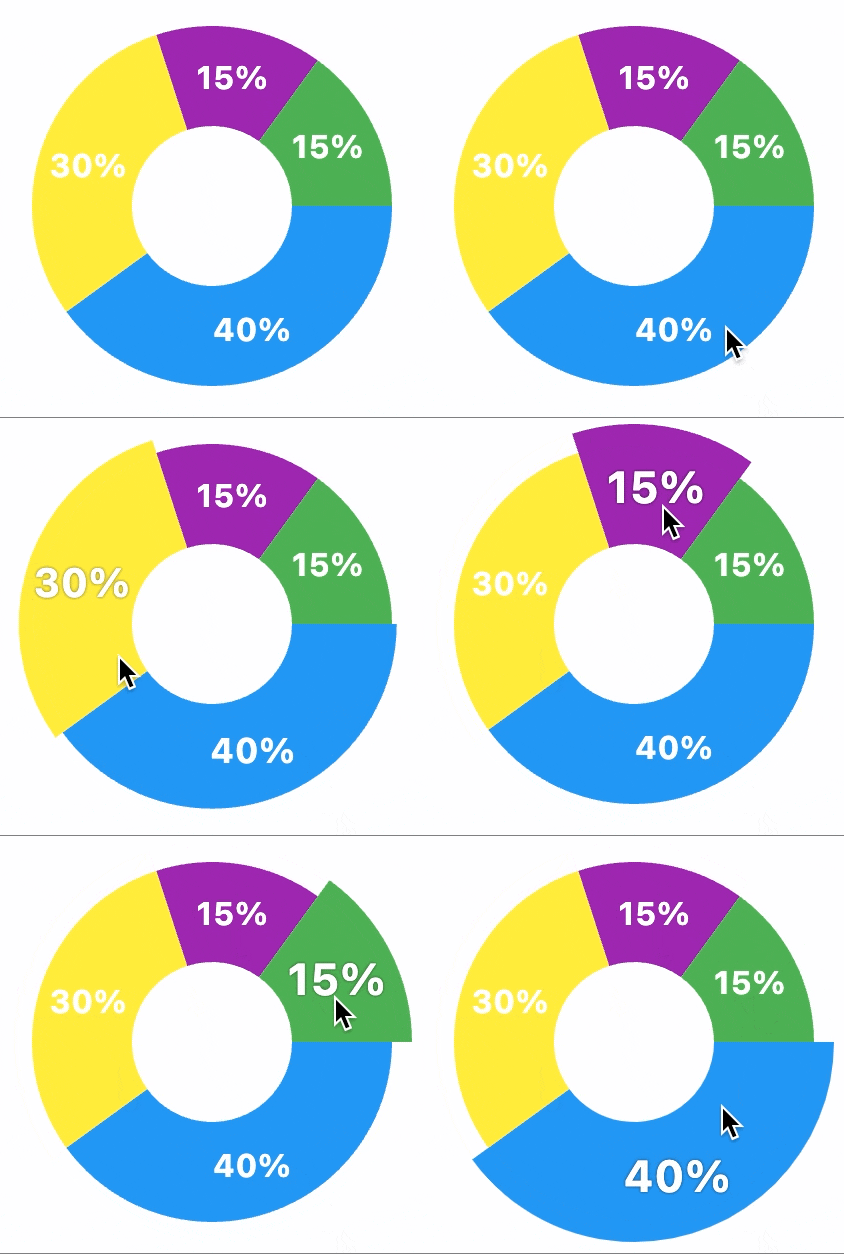
Today we are releasing Flet 0.5.2 with built-in charts 📊 based on the awesome fl_chart library!
Three new chart controls have been introduced:
LineChart

BarChart�

PieChart

We spent a lot of time studying fl_chart library while trying to implement most of its features in a Flet way. However, if you see anything missing in Flet, but available in a library please submit a new feature request.
Other changes
Pyodide 0.23
Pyodide, which provides Python runtime in a browser and is used to run Flet app as a static website, was upgraded to version 0.23 which is based on Python 3.11.2 and giving some size and performance improvements.
Memory leak fixes
In this release we paid a lot of attention to memory leak issues in Flet apps. Now, when a user session is closed its memory is reliably released and garbage-collected. That makes Flet ready for production applications with a lot of users.
Upgrade Flet module to the latest version (pip install flet --upgrade), give charts a try and let us know what you think!
Hey, Flet project has reached ⭐️ 5K stars ⭐️ - thank you all for your continuing support!